

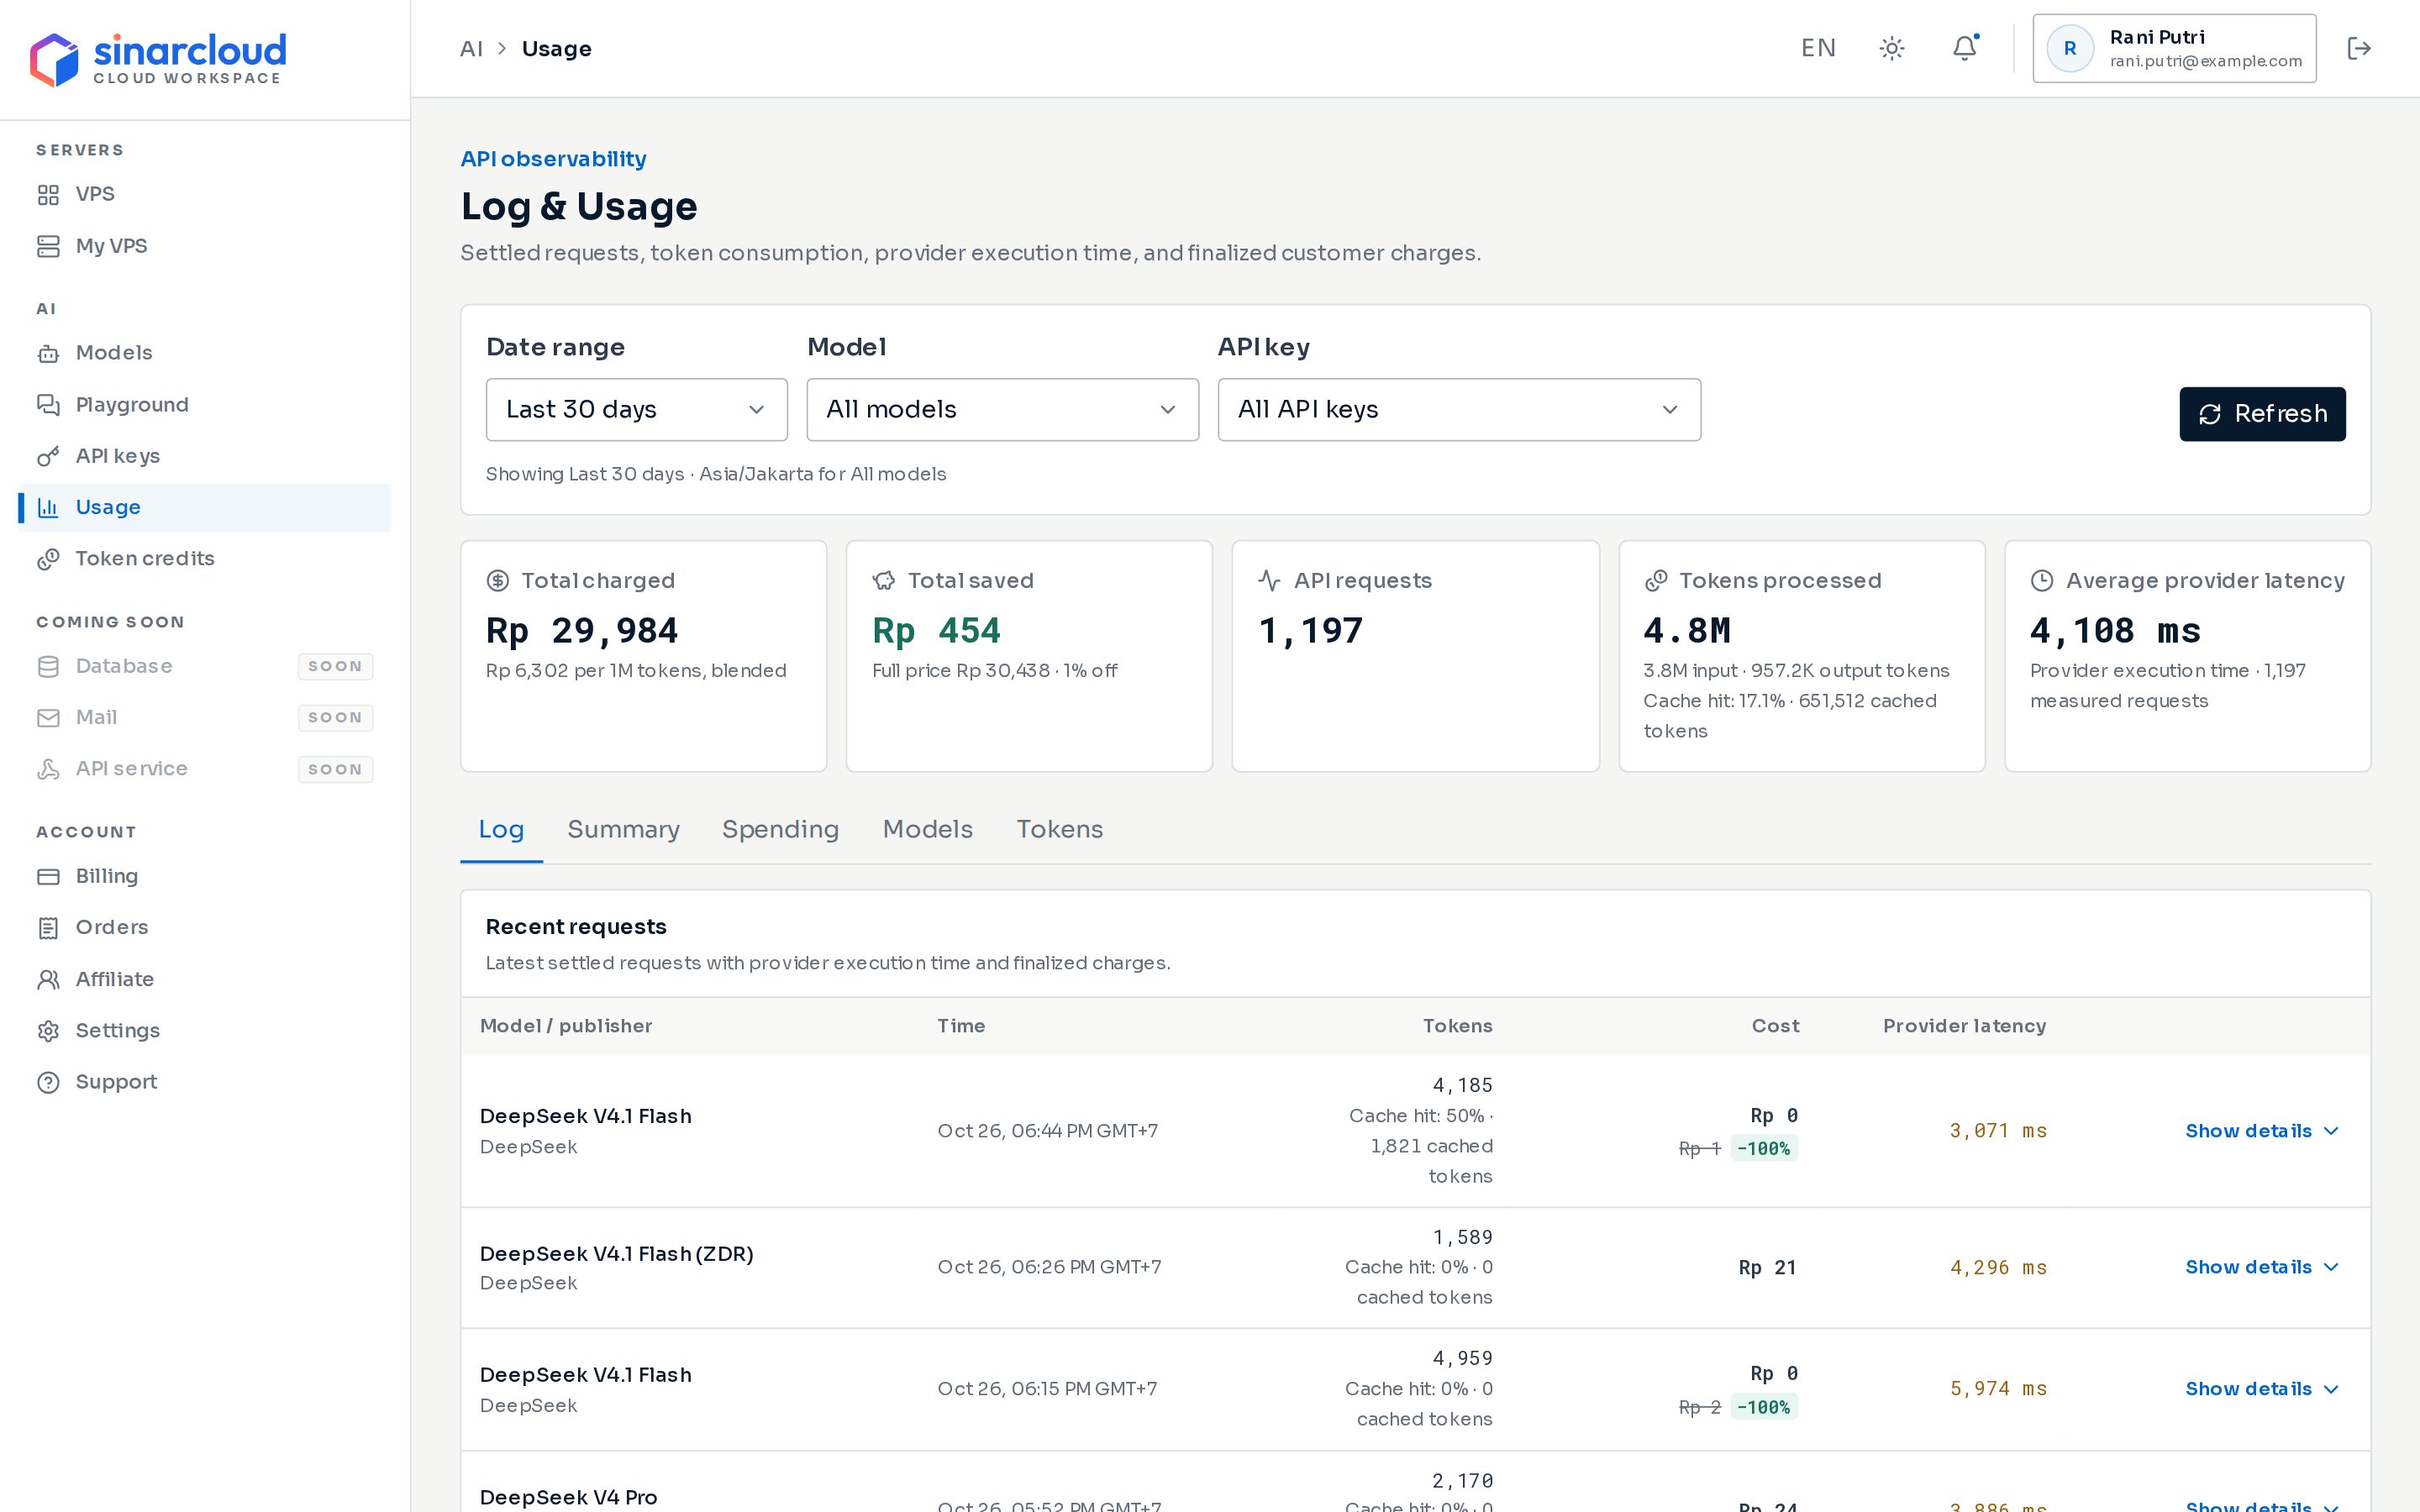
The Usage page with filters, totals and the request log
A request appears shortly after it finishes, once its charge is recorded. If a recent request is missing, wait a moment and click Refresh. A request with no recorded usage is not charged and never appears. A streamed request that stops early, for example because you disconnect, can still be charged and appear here. Its tokens are then estimated from what was streamed. If no requests match the filters, the page shows No requests have settled for this period and these filters and the Log shows No settled requests for these filters.
Filter by date range, model and API key
- Date range: Last 7 days or Last 30 days (the default). The range covers whole calendar days, up to the current time today. Each request counts on the day it started.
- Model: All models, or one model you used in that range, even if it is no longer offered.
- API key: All API keys, or one key you used in that range, shown by its name and the start of the key. A revoked or expired key is marked (inactive).
Totals at the top of the page
Cache hit. Some models can reuse the start of a prompt they processed recently, such as a long system prompt. Cache hit is the share of your input tokens that the model read from this cache. Cached tokens are part of your input tokens, not extra tokens. They are billed at the model’s cache read price, or at the input price if the model has none. Storing a prompt in the cache is a cache write, not a hit. Request details show cache writes as standard and 1h (one-hour) writes. They are billed at the model’s standard and one-hour cache write prices, or at the input price if the model has none. A request that read nothing from the cache, including one on a model without prompt caching, shows a 0% cache hit. Each model’s prices are on Models and pricing.
Latency. This is how long the model took to process a request. It is not the full round-trip time your application sees, and it is not the time to the first token. Requests without a recorded time are left out of the average. Latency depends on the model and on how many tokens the request reads and writes.
Log
The Log tab opens first. Its Recent requests table lists your 8 most recent requests that match the filters, with each request’s model, time, tokens, cost and latency. Latencies above 2,000 ms are highlighted. When token credits or a promotion lowered a request’s price, the Cost column also shows the full price struck through and the percentage saved. Click Show details on a row to see:- Request ID: the value of the
X-Request-Idheader on the API response. - Tokens: input, output, cache hit and cache writes.
- Status: always Settled, because the page shows only requests whose charge is recorded.
- Charge breakdown: shown when token credits or a promotion lowered the price. It lists the Full price, what Token credits covered (the amount and the number of tokens), the promotion and its discount, and the amount Charged.
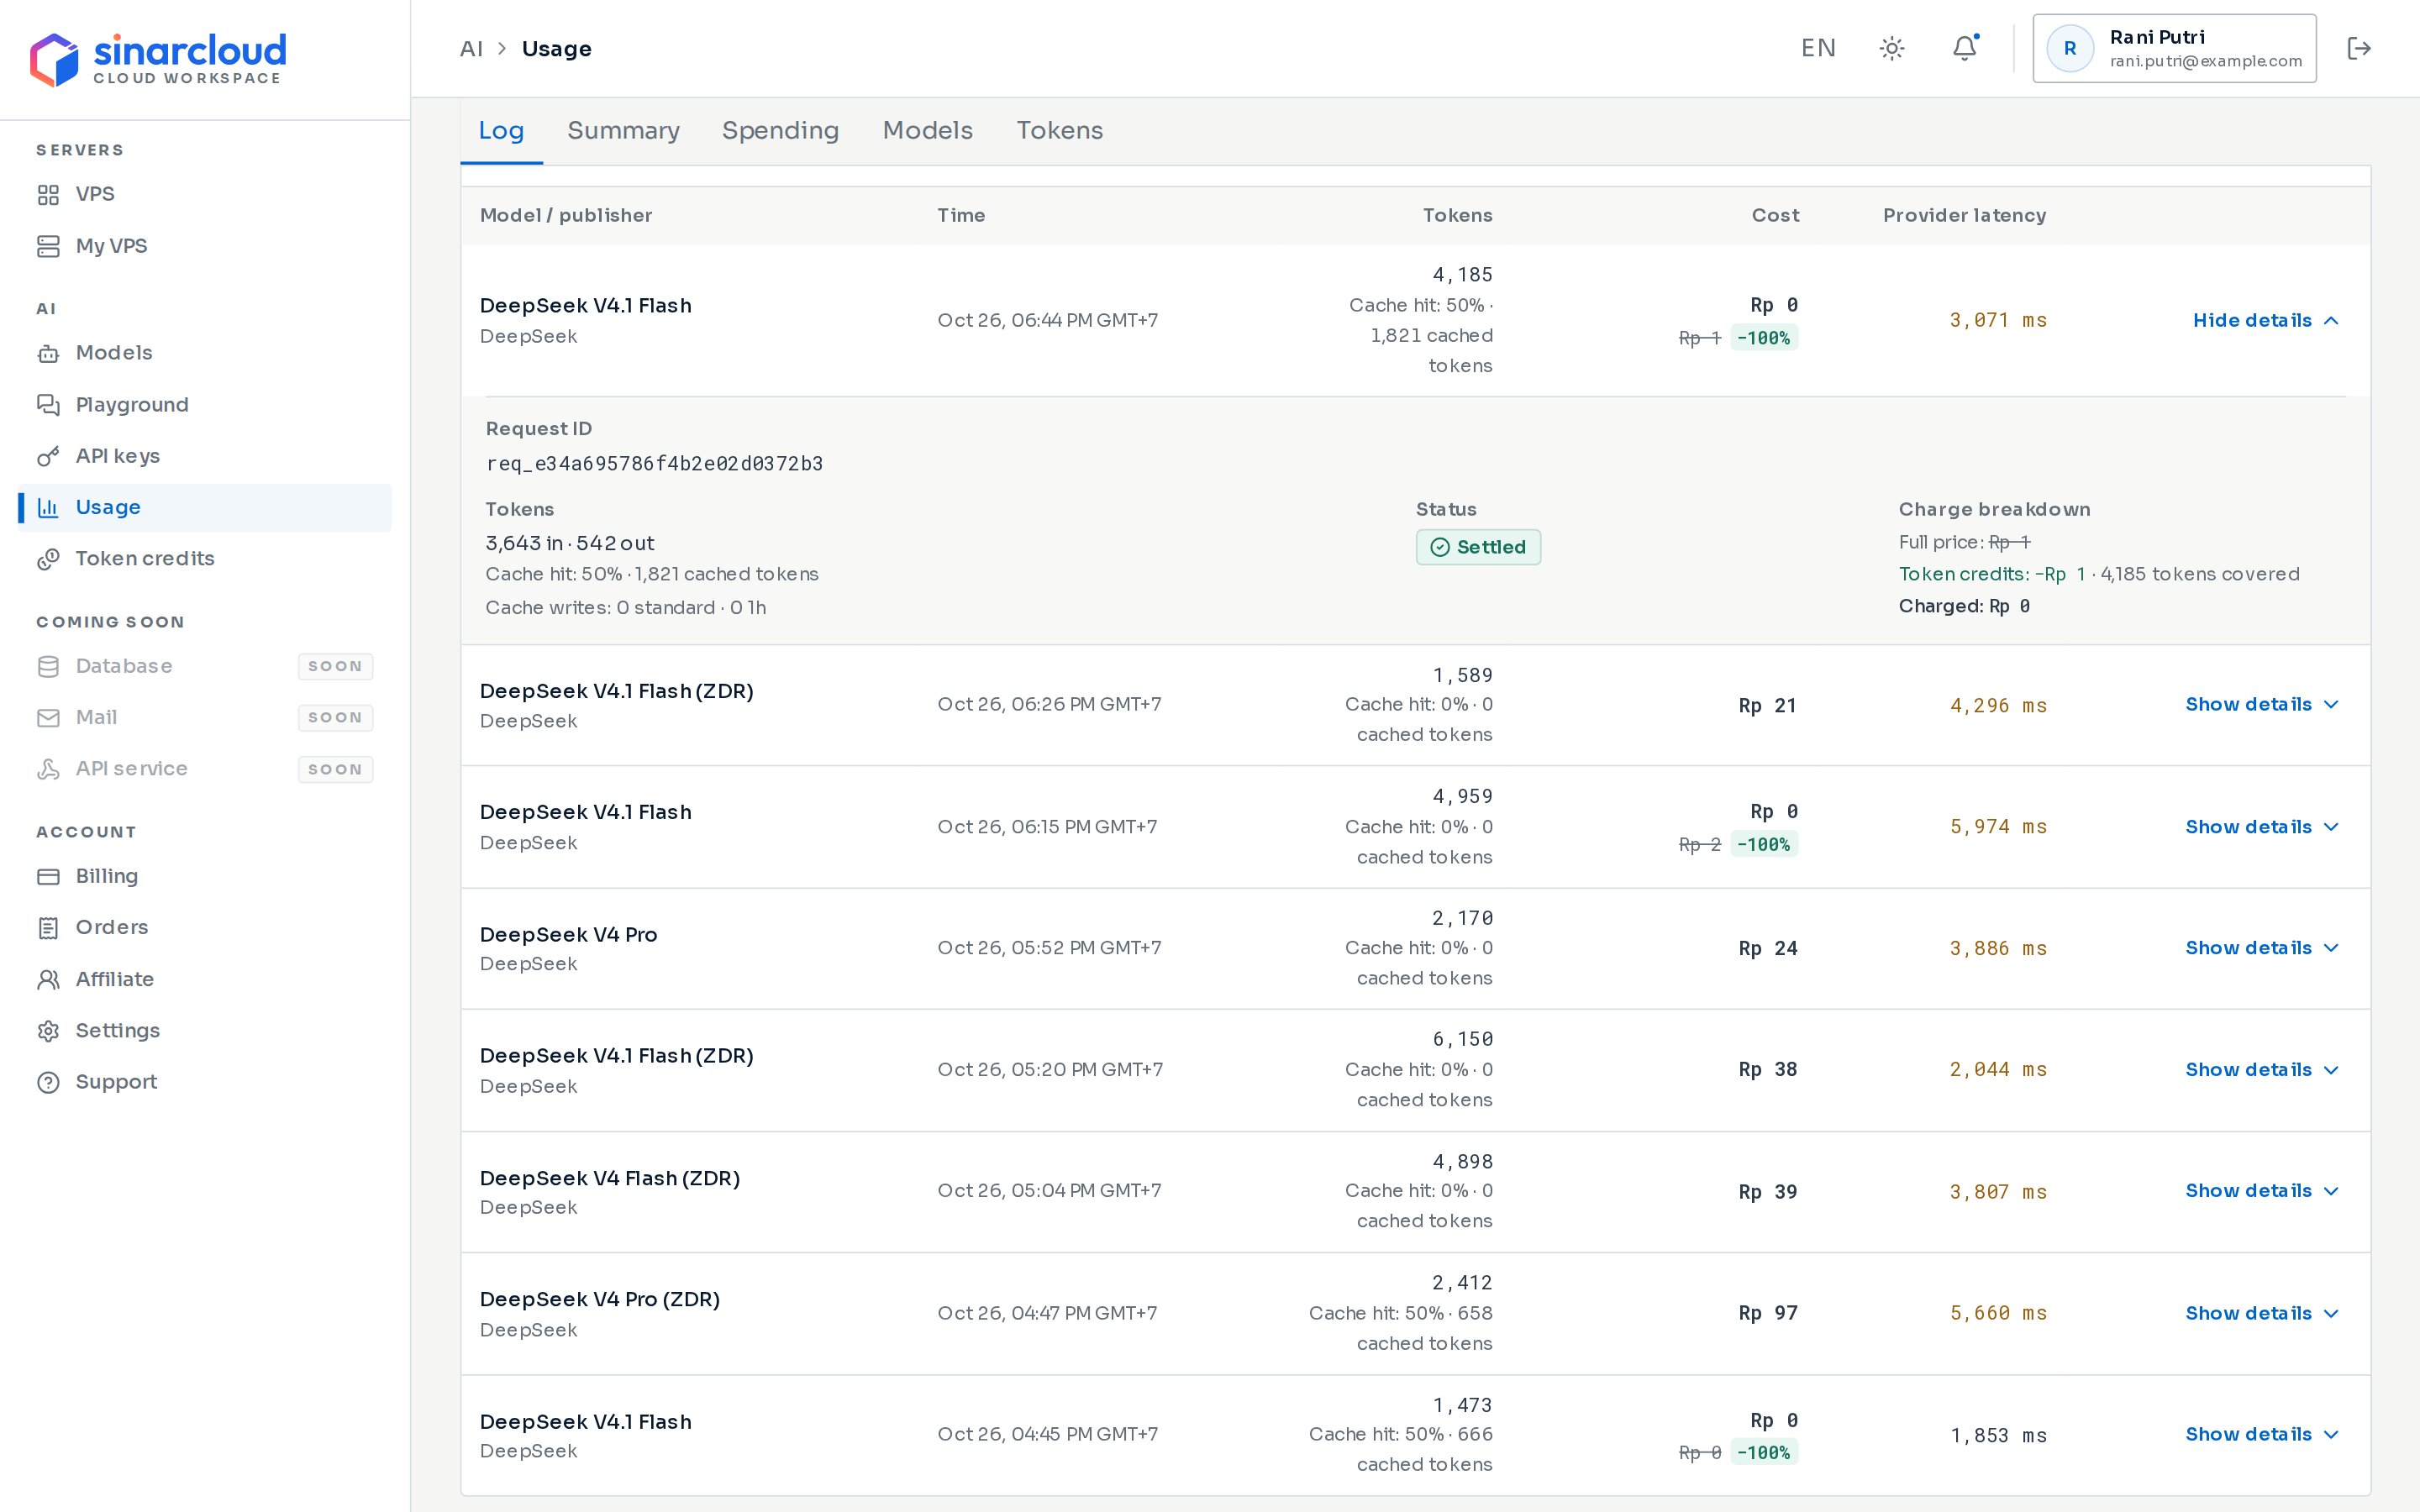
Show details opens a request's ID, tokens and status
Summary
The Summary tab charts your requests per day, with the Total requests, Daily average and Peak day. Open View daily request values to see each day’s count. Below the chart are short versions of the Change in spending and Spend forecast & balance runway cards described in the next section. Click View spending details to open the Spending tab.Spending
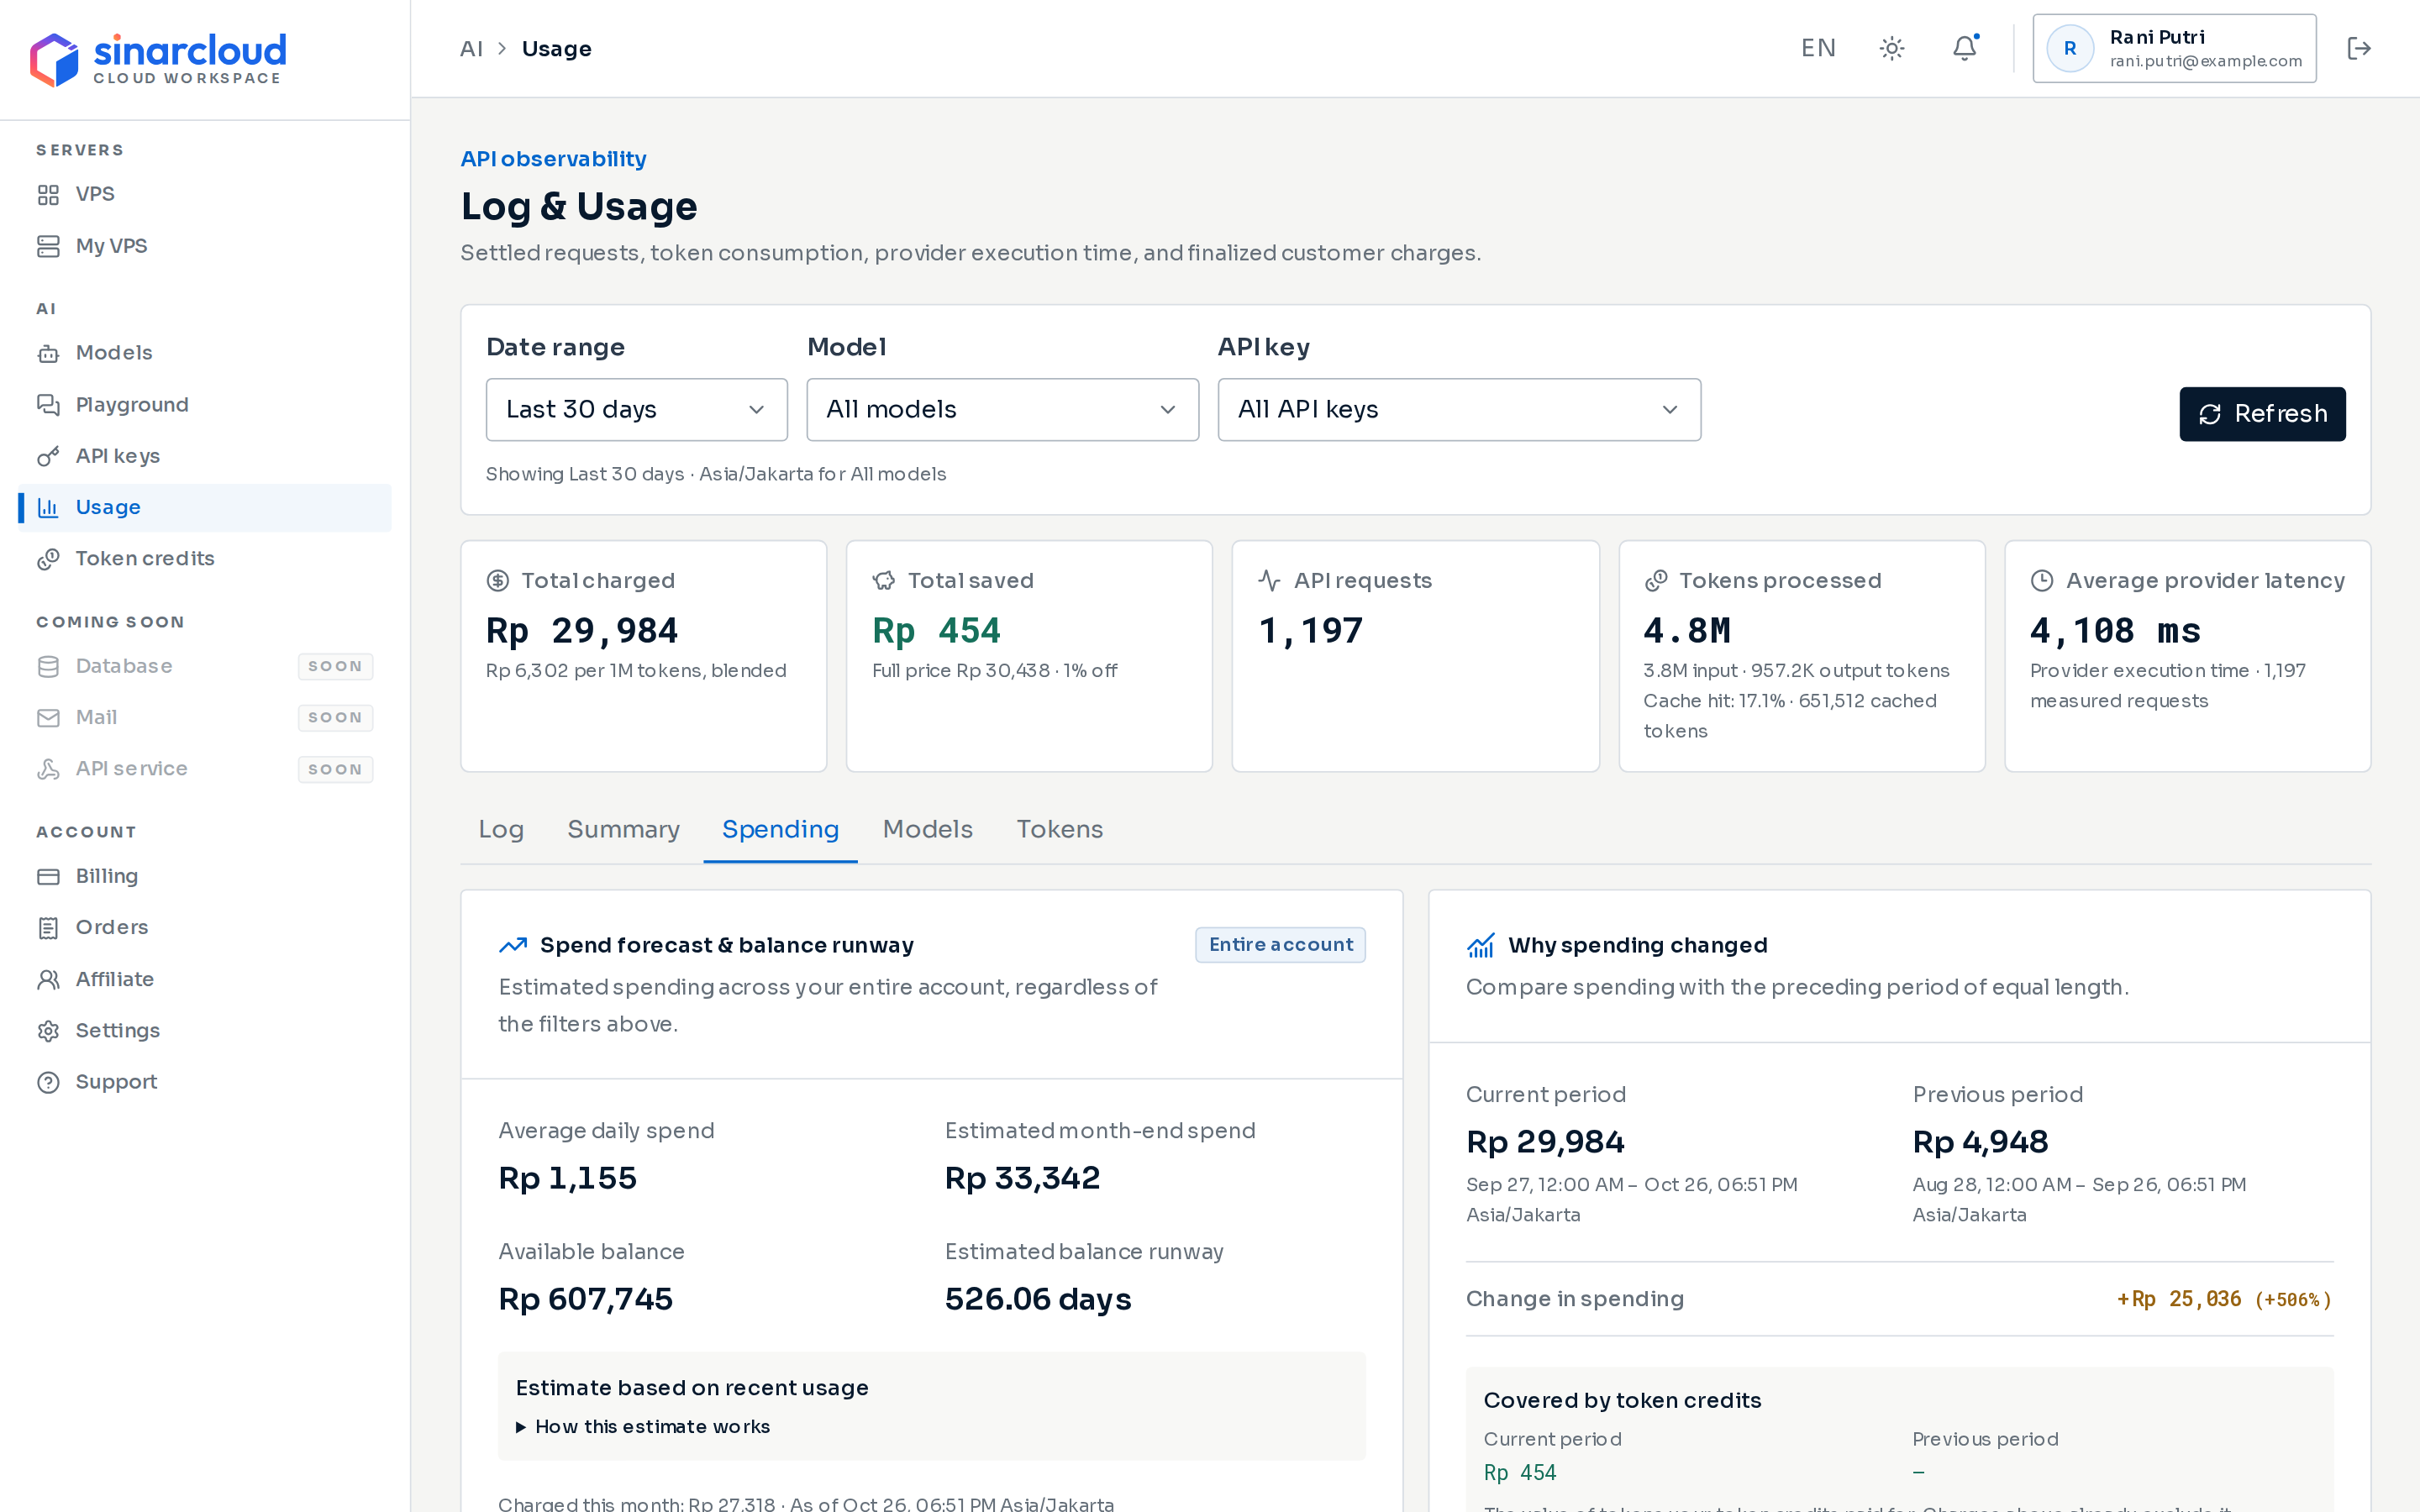
The Spending tab shows the forecast and why spending changed
Spend forecast and balance runway
This card covers your Entire account, so the filters don’t affect it. It shows your Average daily spend, Estimated month-end spend, Available balance (the same figure as Current Credits on the Billing page) and Estimated balance runway. The runway is how many days your balance would last at your average daily spend, with no top-ups or price changes. Below them, Charged this month shows your AI charges so far this month.How the forecast is calculated
How the forecast is calculated
- Average daily spend uses up to the last 7 complete days in your time zone. Today and the day of your first request are left out because they are partial days. Open How this estimate works to see which days were used.
- Estimated month-end spend is your charges so far this month, plus the average daily spend for the rest of the month.
- The forecast needs at least 3 complete days after your first request. Until then it shows More history needed. If those days had no charges, it shows No recent spending and no runway.
Why spending changed
This card compares the current period, up to now, with the previous period of the same length. It shows the Change in spending and splits it into estimated contributions that add up to the total. Covered by token credits shows what credits paid for. The charges on the card already exclude it. Largest changes by model lists up to five models.What each contribution means
What each contribution means
- Request volume: you sent more or fewer requests.
- Tokens per request: your requests got larger or smaller.
- Model mix and effective rates: the rest of the change before discounts and credits, such as switching models or a different mix of input and output tokens.
- Promotion savings: the change in promotion discounts. A negative amount means discounts saved you more than in the previous period.
- Token credits: shown if you used token credits in either period. A negative amount means token credits covered more than in the previous period.
Promotion savings
When promotions discounted your requests in the selected range, this card shows Total saved, Before discounts, Amount charged and Discounted requests, with the percentage saved. It has a row for each promotion, including promotions that have ended. Otherwise it shows No promotion savings in this period. This card’s Total saved and percentage count promotion discounts only, not token credits. Before discounts and Amount charged cover every request in the range, like the full price and Total charged at the top of the page. If token credits paid for part of your usage, the gap between them is larger than Total saved.Models
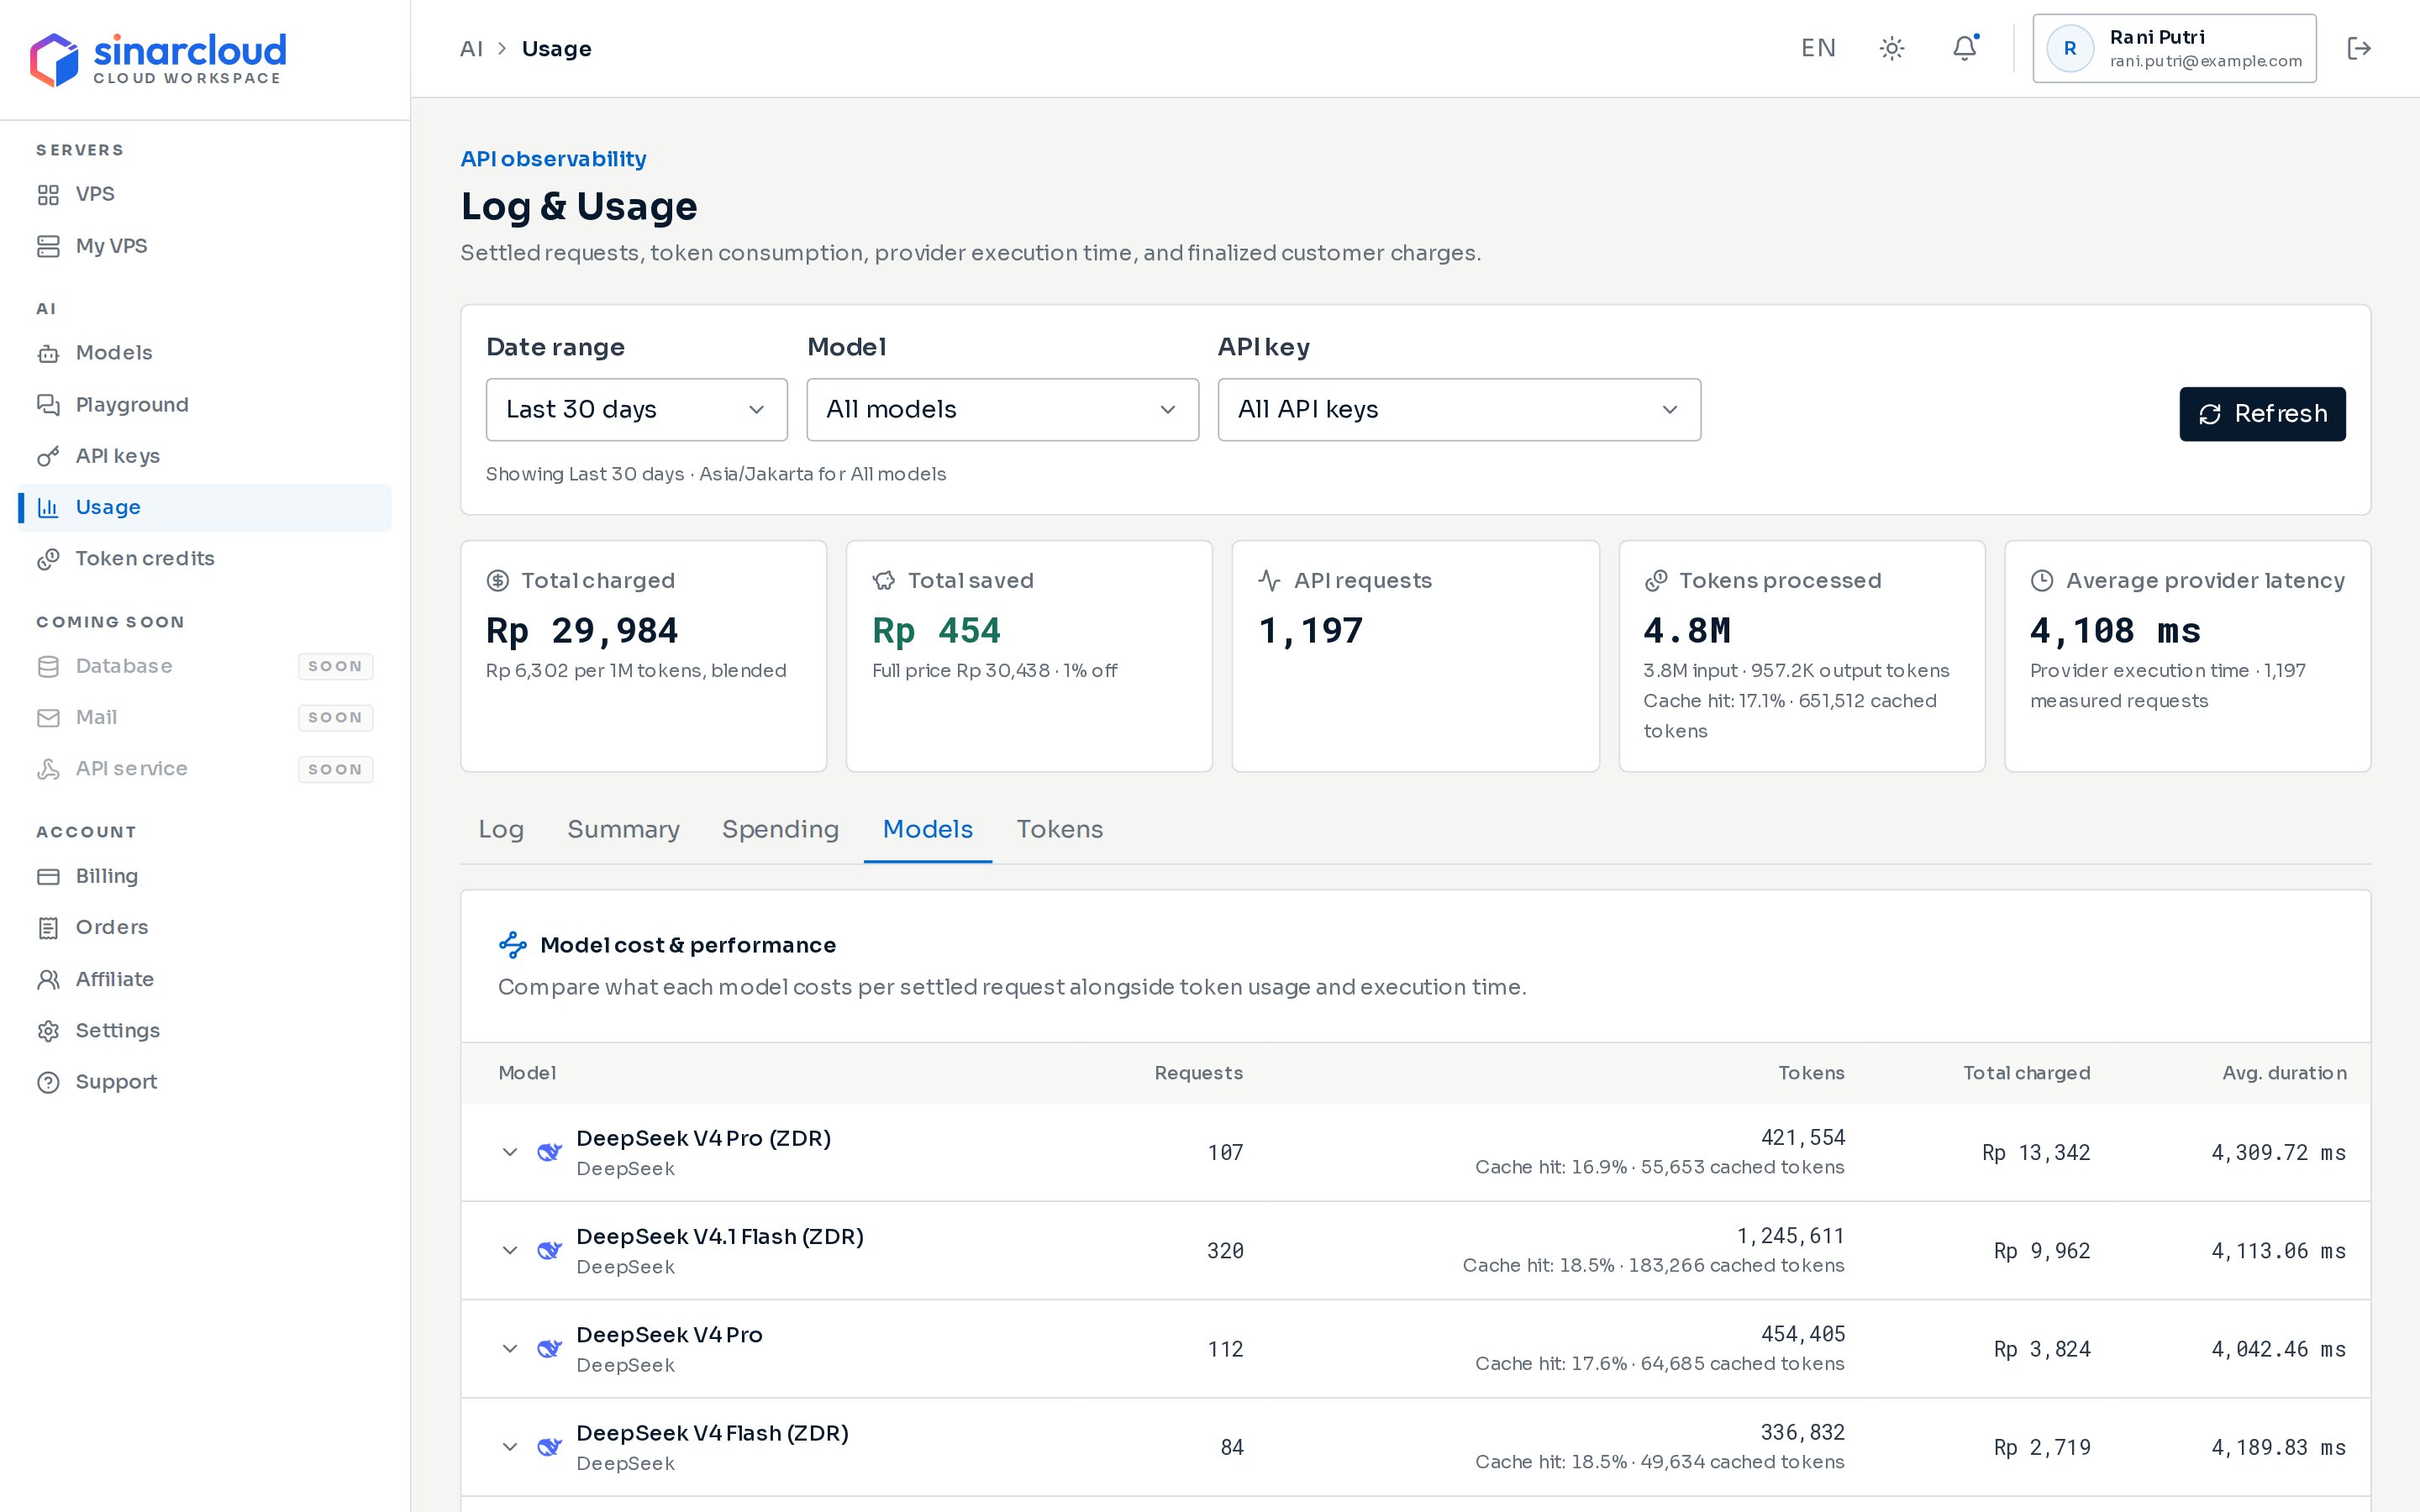
The Models tab compares cost and performance per model
Tokens
The Tokens tab shows your input and output tokens and their share of all tokens, and your Average input / request and Average output / request next to the previous period. It also compares your cache hit with the previous period and counts your cache writes. The daily chart stacks Other input, Cached input and Output tokens. Click a legend item to show or hide it. Open View daily token values for each day’s exact counts. To see how input, cached, output and total tokens are counted, with worked examples, see How tokens are counted.Reconcile usage with your balance
AI requests are charged after they finish. On the Billing page, the Transactions tab adds up each day’s AI charges into one AI usage transaction. It shows the date, the number of requests and the total amount. Click AI usage to open the Usage page. Days follow the Time Zone saved on your account. See Balance and billing. To check a period, compare Total charged (with All models and All API keys selected) with the sum of the AI usage transactions over the same days. The totals can differ slightly at the edges of the range:- The Usage page dates a request by when it started. The AI usage transaction dates it by when its charge was recorded, so a request that runs past midnight can land on different days.
- A day whose AI requests cost nothing, for example because token credits paid for all of them, has no AI usage transaction.
- VPS orders, renewals, top-ups and balance coupons change your balance but never appear on the Usage page. A coupon that unlocks an AI usage discount shows up as a promotion.
- A request that has already run is always charged, even if your balance goes below zero. Your next top-up pays off the negative amount first.
- To start a request on a paid model, your balance must be above zero, you must have token credits left for that model, or a promotion must cover the model’s full price.